Observed Hospitalization and Medicare Spending in a Primary Care Panel (2010-2014) — Dennis Y. Fong, MD
1. Observed Hospitalization Rates by CMS-HCC Risk
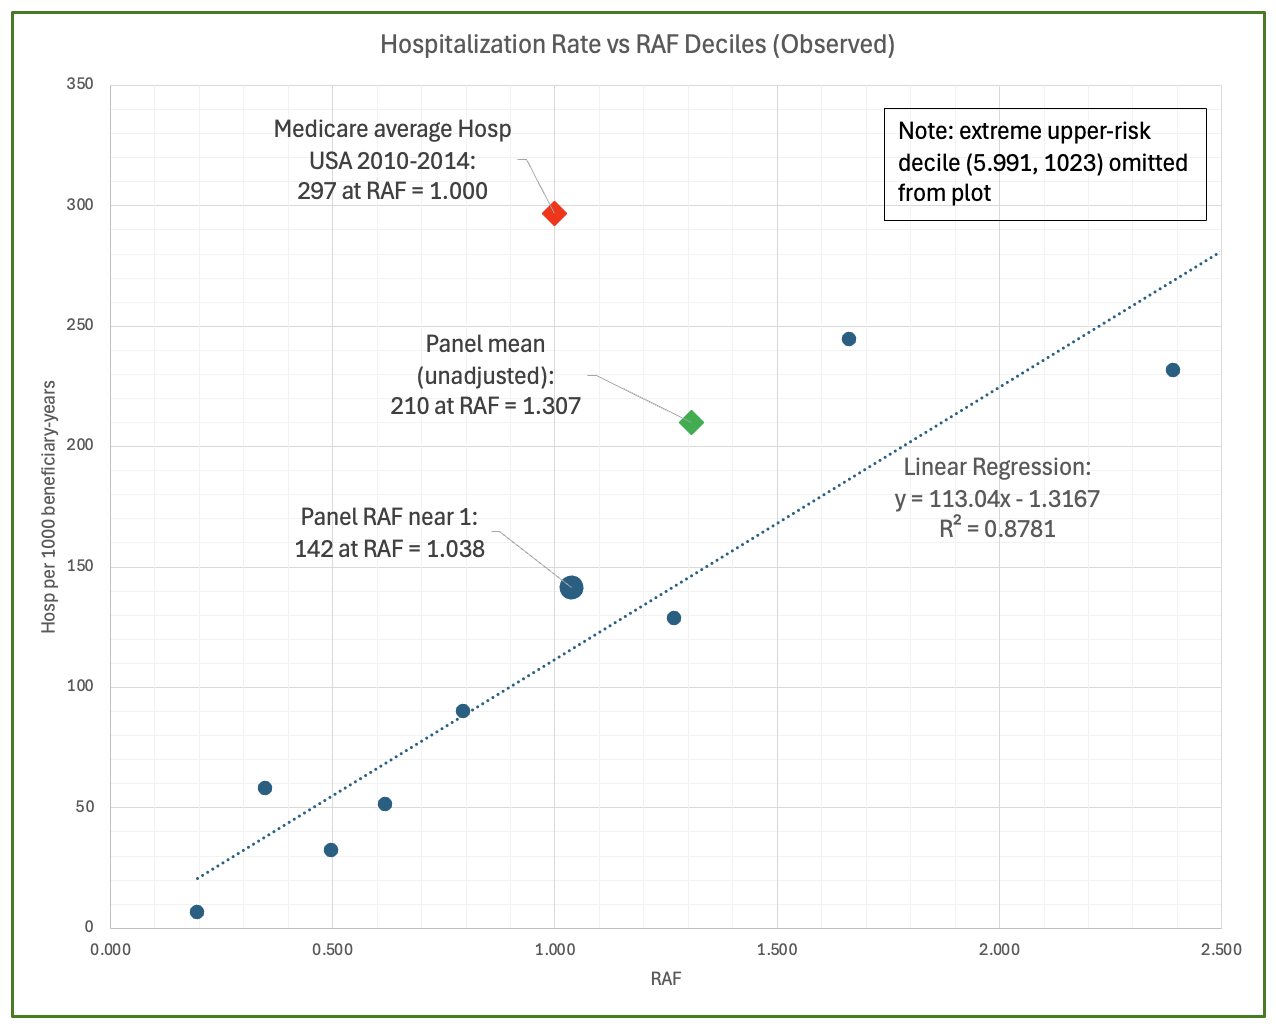
Observed Hospitalizations by CMS-HCC risk (2010-2014):
Beneficiary-years in the primary care panel are ranked by CMS-HCC risk adjustment factor (RAF) and grouped into deciles. Points
show observed Medicare Part A inpatient admissions per 1,000 beneficiary-years (Medicare patient-years) within those RAF risk-ranked
deciles, plotted against the mean RAF of each decile. No statistical model is imposed. At RAF ≈ 1.0, this panel experienced 142 admissions per
1,000 beneficiary-years — approximately 52% lower than the contemporaneous national fee for service (FFS) Medicare average of 297.
(Figure updated to reflect the current manuscript version for consistency of presentation.)
View Hospitalization Distribution Across RAF-ranked Deciles
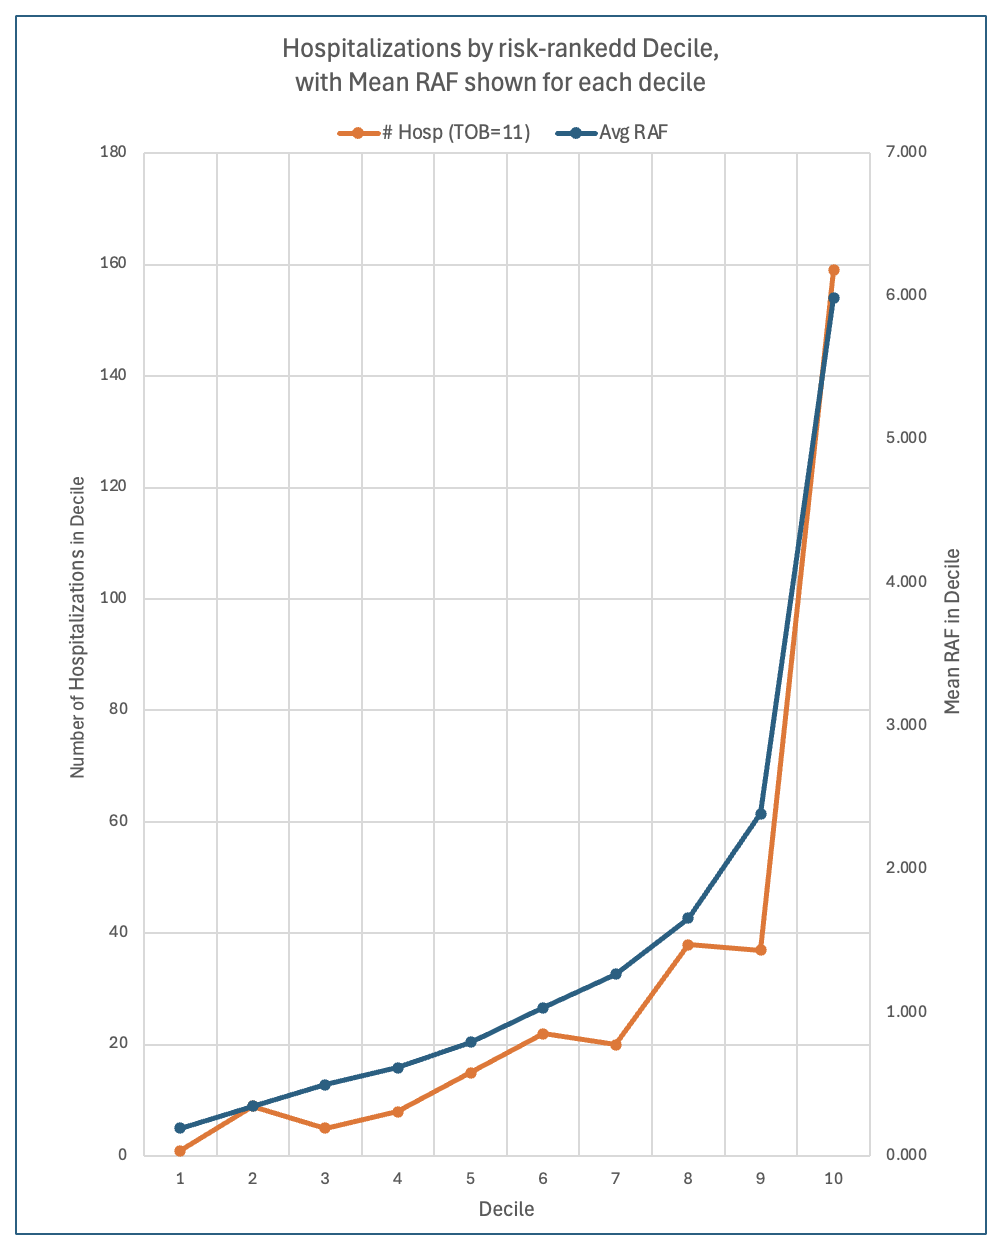
Observed Medicare Part A inpatient hospitalizations rise nonlinearly across deciles ranked by RAF, with a steep increase showing utilization concentrated in the highest-risk decile. (Each decile contains an equal number of beneficiary-years.)
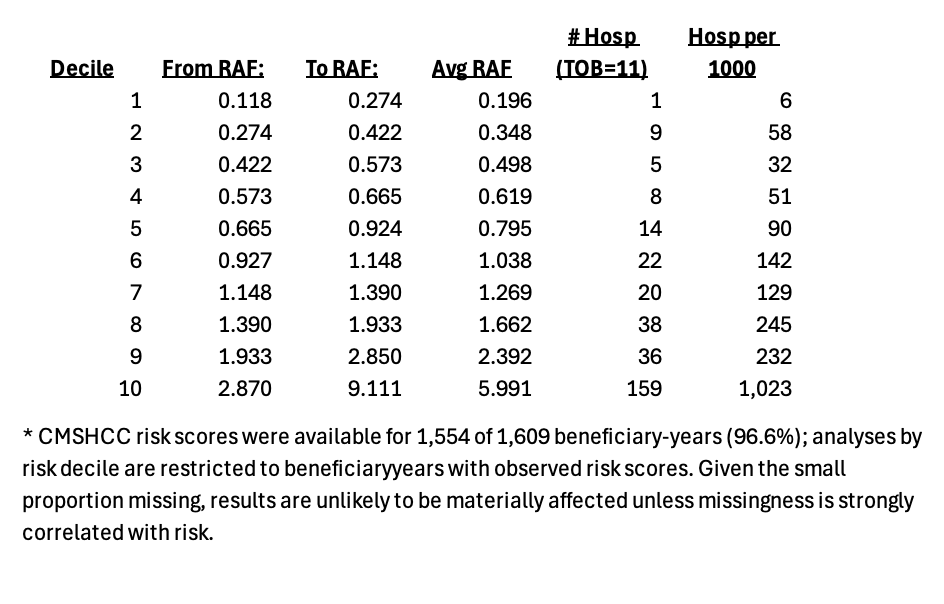
View hospitalization rate data
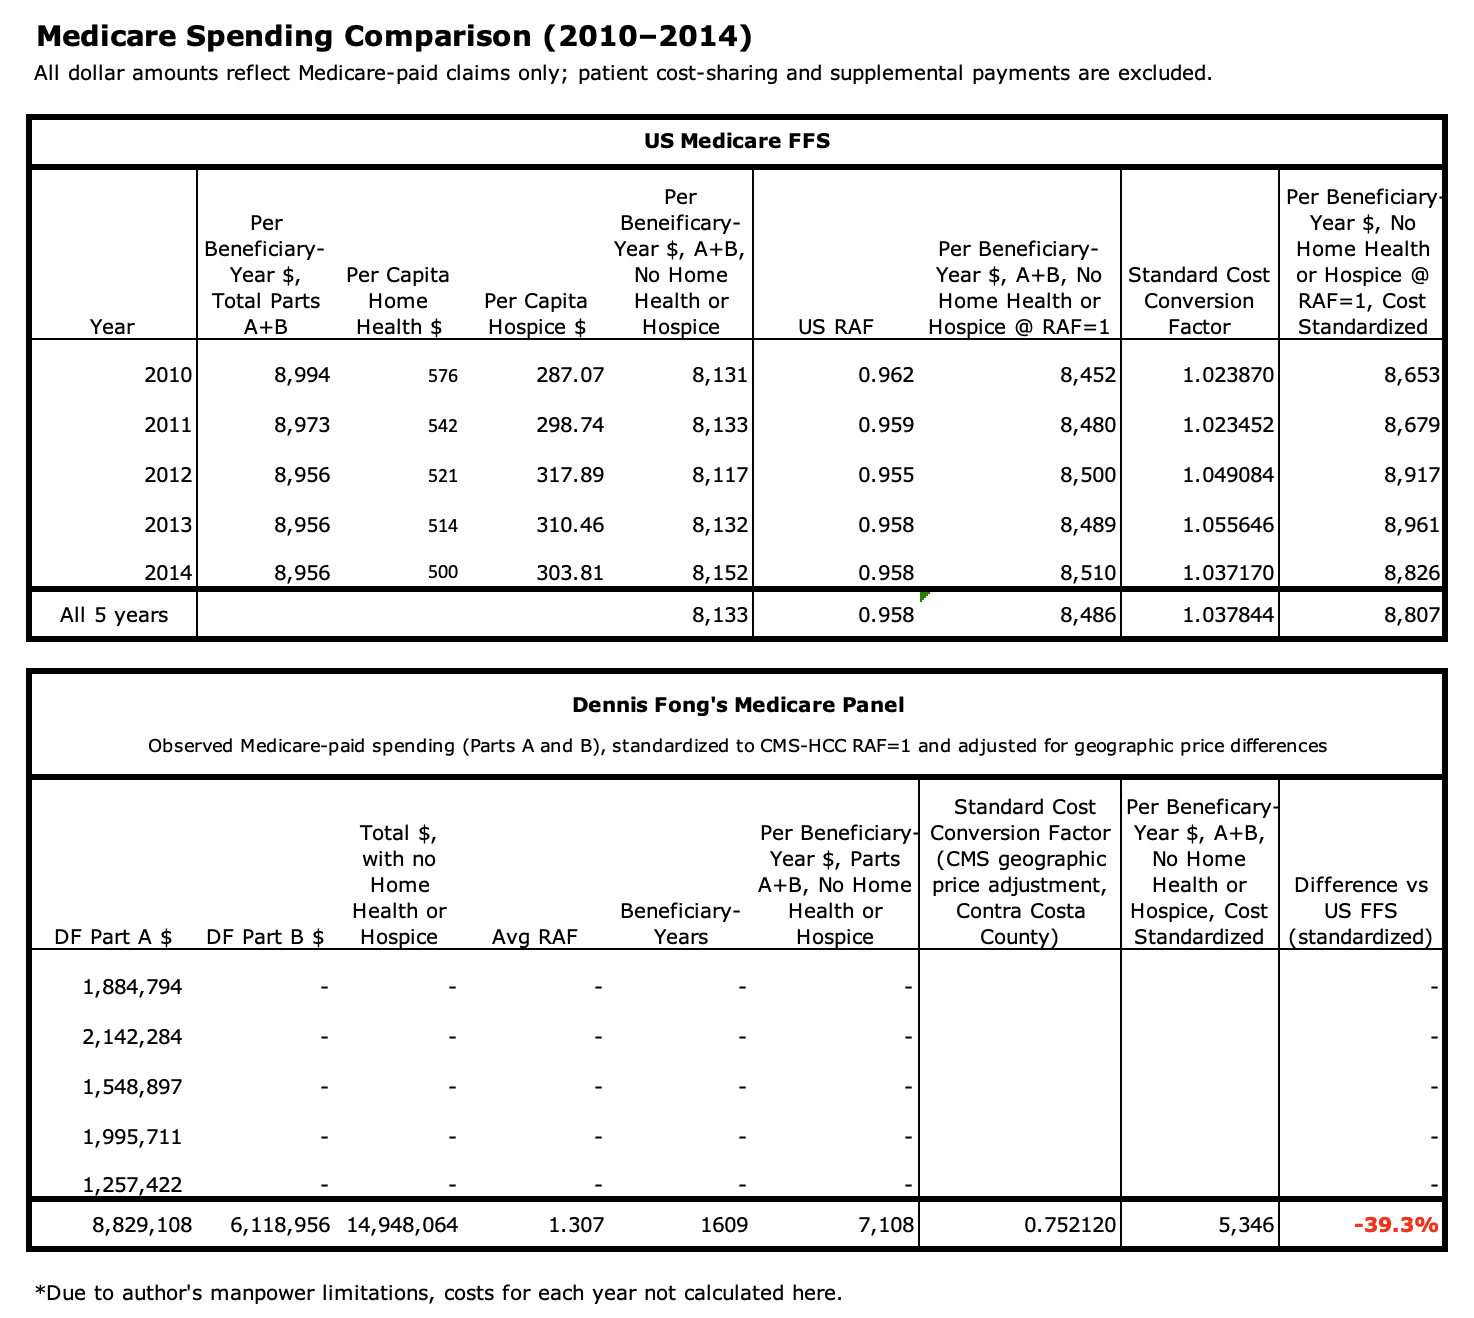
2. Medicare Spending (Risk- and Geography-Standardized)
Over 2010-2014, average Medicare spending in this panel was $5,346 per beneficiary-year , compared with $8,807 for U.S. FFS Medicare — representing a 39% lower Medicare spending. Patient cost-sharing and supplemental insurance payments are not included, consistent with CMS ACO and REACH benchmarking conventions. This Medicare spending comparison reflects Medicare-paid amounts only (Parts A and B), standardized for risk at CMS-HCC RAF of 1 and geographical price differences using CMS-consistent methods.
View Medicare spending comparison data
Data and risk adjustment note:
Medicare claims data (Parts A and B) were obtained from CMS. CMS-HCC risk adjustment factors (RAFs) were calculated by the author
using contemporaneous clinical documentation and EHR-generated HCC mappings. For higher-risk beneficiaries, HCCs were constructed
manually from active problem lists, associated ICD-9 diagnoses, and recent hospitalization diagnoses; for lower-risk beneficiaries,
RAF values displayed within the EHR were used. Because RAFs were derived from documentation by the practice
rather than directly from CMS claims files, some diagnoses billed by hospitals, specialists, or nursing facilities may not have been
captured. Any resulting bias would probably be toward under-statement of risk and thus the observed reductions in utilization and Medicare
spending as well.
A manuscript based on this analysis will be prepared for journal submission.